The first six months of 2020 produced a schizophrenic roller coaster ride in the U.S. stock market that has redefined the meaning of volatility.
The monthly total returns shown below are for the S&P 500 Index. January started off with a fractional loss of -0.04%. No big deal. February turned ugly with a loss over 8%. March derailed with a loss of over 12%. At that point, the future looked rather bleak.
April stormed back with a gain of nearly 13%, followed by a return of 4.8% in May. June was up and down but finished with a modest gain of 1.99%. Overall, the first six months of 2020 produced a loss of 3.08% in the S&P 500 Index. The amount of volatility along the way undoubtably made it feel much worse.
The S&P 500 Index is only one measurement of performance. Morningstar carves up the world of investments into categories that permit a granular look at mutual fund and ETF performance.
I thought it would be interesting to review performance for the first six months of 2020 through the lens of 89 fund categories.
As shown in Table 1, we start with the category of “Allocation—15%–30% Equity.” The largest fund in this category is Vanguard Life Strategy Income Investor with total assets of nearly $5.3 billion. However, the best-performing fund in this category for the first six months of 2020 was Columbia Thermostat (CYYYX) with a total percent return of 15.25%. The average return of the 194 funds in this category was -0.48%, while the worst performer in the group ended up with a return of -13.18%.
The best-performing fund from January 1 through June 30, 2020 among these 89 fund categories (representing over 25,000 funds) was ProShares Ultra VIX Short-Term Futures (UVXY). It turned in a six-month return of 159.81%. The category average was 41.43%. The worst performing volatility fund among the 18 funds in this category posted a six-month return of -60.60%. It mattered which one you picked. However, it’s worth examining the whipsaw monthly returns for UVXY in 2020 before you jump on your computer and buy some shares.
The 2020 monthly returns for UVXY are as follows:
- January: +9.33%
- February: +58.79%
- March: +165.89%
- April: -27.02%
- May: -22.77%
- June: -0.13%
Big returns nearly always come with big swings. Impeccable timing is often needed to benefit from those swings in performance—and that sort of timing is not a knack widely possessed.
Another fund with outstanding performance in the first half of 2020 was GMO Special Opportunities (GSOFX) with a return of 78.54% (in the U.S. Large Growth category). Several other category winners included ARK Genomic Revolution (ARKG) with a return of 55.41%, WisdomTree Cloud Computing ETF (WCLD) at 52.43%, and ProShares Online Retail ETF (ONLN) with a return of 41.89%. I highlight these three particular funds because they represent the information and technology age that increasingly defines our investment world.
Another interesting observation is the dominating performance of DFA and Manning & Napier in the target-date fund space. (Click here for larger image of the table.)
Table 1: Performance by Fund Category, First 6 Months of 2020
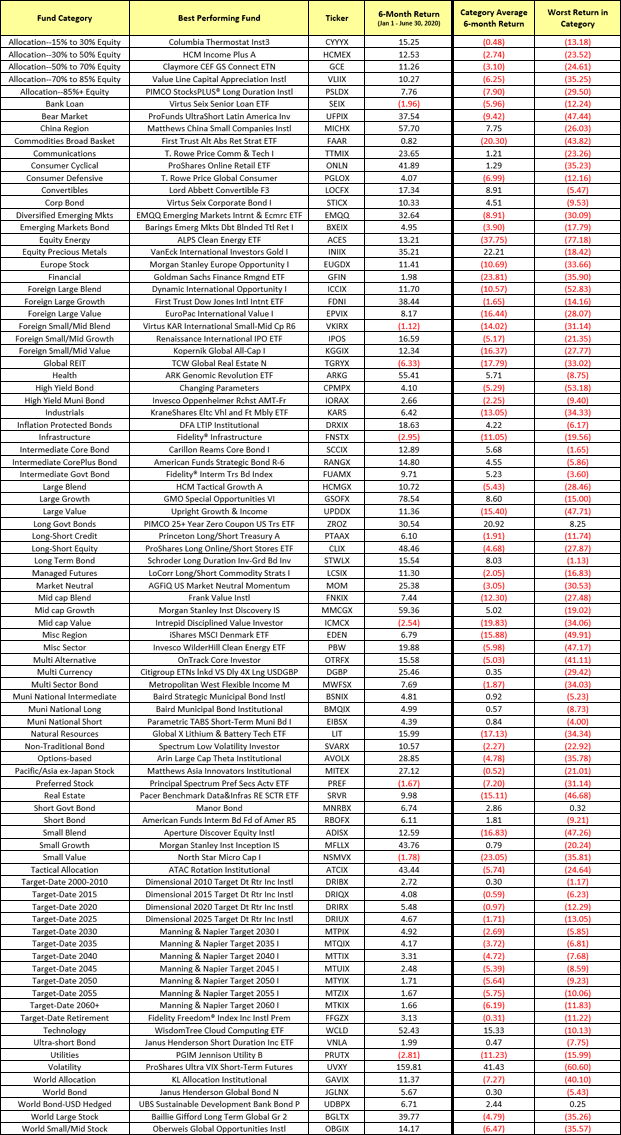
Source: Craig Israelsen
Another interesting view of first-half 2020 performance is shown in Figure 1 where we see the six-month performance of the largest 100 funds (mutual funds and ETFs). These 100 funds represent just 0.38% of the total number of funds (over 26,000 funds in the Morningstar universe as of 6/30/20) but hold 31% of all the assets. As can be seen, only 40% of the largest 100 funds produced a positive return during the first half of 2020. The average six-month return for these 100 mega funds was -1.08%. But, the asset-weighted return among these 100 funds was a bit worse at -1.41%. target-date fund space. (Click here for larger image of the figure.)
Figure 1: Performance in First Half of 2020 for the 100 Largest Funds
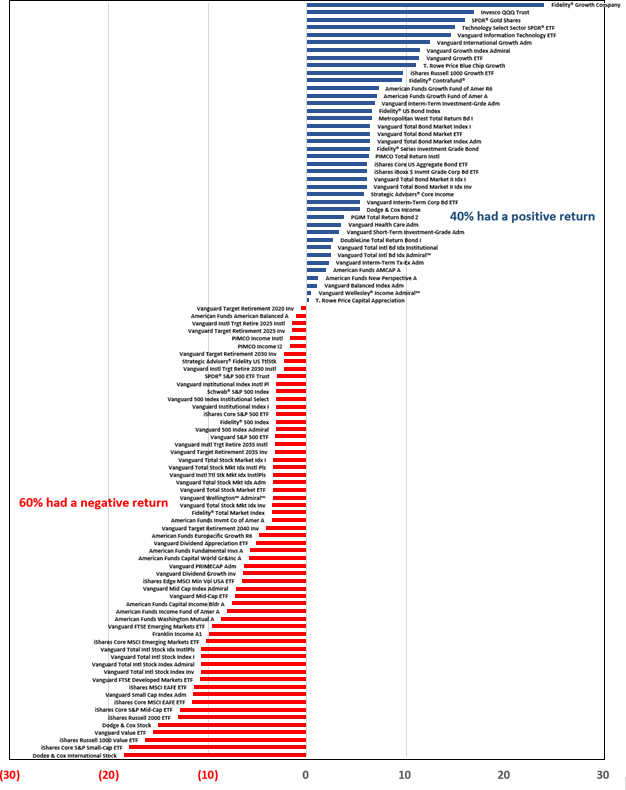
Source: Craig Israelsen
Let’s hope that in six months I’ll be able to update this article with more encouraging results.